

The Extragalactic Distance Database (EDD)
IMPORTANT!! The initial release of tables associated with Cosmicflows-4 in August, 2022, were flawed. NOT TO BE USED! The corrected tables were made available online with the publication of the article and are available at this site.
The catalog All CF4 Individual Distances provides distances to the 55877 galaxies within z=0.1 in the Cosmicflows-4 compendium of distances. The catalog CF4 All Groups provides averaged distances and velocities for 38057 groups. The catalog CF4 All Group Velocities provides derivative information. These catalogs corespond to Tables 2, 3, and 4, respectively, in the publication "Cosmicflows-4" by Tully et al. 2023.
The catalog Cosmicflows-3 Distances gives distances for almost 18000 galaxies, mostly within 15,000 km/s but extending to 30,000 km/s.
The two catalogs 2MRS1175 Groups (split North and South) gives group identifications for galaxies in the 2MASS Redshift Survey to K=11.75.
The catalog Kourkchi-Tully Groups gives group identifications for 15,000 galaxies within 3,500 km/s.
 The first group of catalogs are based on redshift surveys
and provide general information about galaxies in the local
volume. The "2MASS Redshift Survey" and the
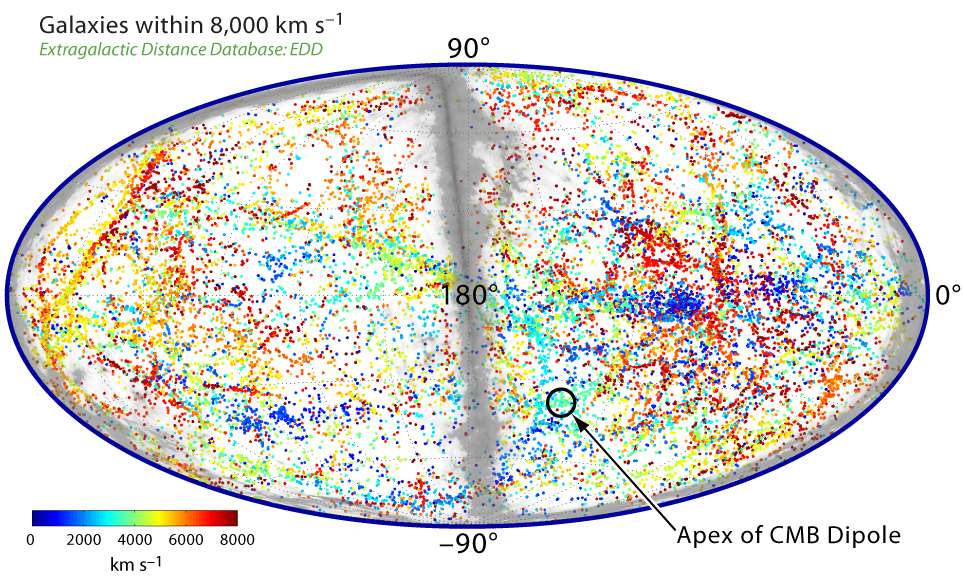
"V8k" (velocity < 8,000 km/s) catalog
provide alternative descriptions of the large scale structure in the region of
interest. The latter is a compilation of redshifts drawn from
CfA ZCAT
and other literature sources. The figure shows the distribution of the galaxies
in V8k in Supergalactic coordinates. Colors indicated velocities as defined
by the scale at lower left. The apex of the Cosmic Microwave Background is
identified.
The first group of catalogs are based on redshift surveys
and provide general information about galaxies in the local
volume. The "2MASS Redshift Survey" and the
"V8k" (velocity < 8,000 km/s) catalog
provide alternative descriptions of the large scale structure in the region of
interest. The latter is a compilation of redshifts drawn from
CfA ZCAT
and other literature sources. The figure shows the distribution of the galaxies
in V8k in Supergalactic coordinates. Colors indicated velocities as defined
by the scale at lower left. The apex of the Cosmic Microwave Background is
identified.
The subsequent catalogs are alternatively drawn from the literature or compiled by the curators of this database; each provides some element of information useful for the determination of distances to galaxies. The database contains original contributions of data, or independent reductions of archival data, in the catalogs "CMDs/TRGB", "All Digital HI", "Hawaii Photometry", and "Spitzer [3.6] Band Photometry".
 The catalog "CMDs/TRGB" provides Color-Magnitude Diagrams (CMD),
photometry tables, and Tip of the Red Giant Branch (TRGB) fits for galaxies
observed with Hubble Space Telescope, either by the
curators or by others and
with data drawn from the HST archive. Reductions are carried out using the stellar photometry packages developed
by Andrew Dolphin:
HSTPHOT for WFPC2 images and
DOLPHOT for ACS images.
TRGB fits are based on a maximum likelihood procedure discussed by
Makarov et al. 2006.
TRGB zero point issues were discussed by
Rizzi et al. 2007.
The CMD for Antlia dwarf galaxy is shown
as an example. The contents of this catalog are described by
B.A. Jacobs, L. Rizzi, R.B. Tully, E.J. Shaya, D. Makarov, and L. Makarova 2009, AJ, 138, 332
`The Extragalactic Distance
Database: Color--Magnitude Diagrams'
The catalog "CMDs/TRGB" provides Color-Magnitude Diagrams (CMD),
photometry tables, and Tip of the Red Giant Branch (TRGB) fits for galaxies
observed with Hubble Space Telescope, either by the
curators or by others and
with data drawn from the HST archive. Reductions are carried out using the stellar photometry packages developed
by Andrew Dolphin:
HSTPHOT for WFPC2 images and
DOLPHOT for ACS images.
TRGB fits are based on a maximum likelihood procedure discussed by
Makarov et al. 2006.
TRGB zero point issues were discussed by
Rizzi et al. 2007.
The CMD for Antlia dwarf galaxy is shown
as an example. The contents of this catalog are described by
B.A. Jacobs, L. Rizzi, R.B. Tully, E.J. Shaya, D. Makarov, and L. Makarova 2009, AJ, 138, 332
`The Extragalactic Distance
Database: Color--Magnitude Diagrams'
 The catalog "All Digital HI" provides
graphical displays and derivatives from a uniform analysis of digital
HI linewidth
information drawing on our own observations with the
Green Bank and
Arecibo telescopes and much more information gathered from
archives.
An example is shown of an HI line profile observed with the Green Bank Telescope.
This component of the database is described by H.M. Courtois et al.
2009, AJ, 138, 1938
`The Extragalactic Distance
Database: All Digital HI Profile Catalog'
and 2011, MNRAS, 414, 2005
`Cosmic Flows: Green Bank Telescope
and Parkes HI Observations'
The catalog "All Digital HI" provides
graphical displays and derivatives from a uniform analysis of digital
HI linewidth
information drawing on our own observations with the
Green Bank and
Arecibo telescopes and much more information gathered from
archives.
An example is shown of an HI line profile observed with the Green Bank Telescope.
This component of the database is described by H.M. Courtois et al.
2009, AJ, 138, 1938
`The Extragalactic Distance
Database: All Digital HI Profile Catalog'
and 2011, MNRAS, 414, 2005
`Cosmic Flows: Green Bank Telescope
and Parkes HI Observations'
The catalog "Hawaii Photometry" provides graphic and derivative results from a
program of galaxy photometry carried out with the University of Hawaii 2.2m
telescope at Mauna Kea Observatory.
The I band surface brightness as a function of radius is shown for the galaxy
corresponding to the HI profile illustrated above. The I band photometry program is
discussed by H.M. Courtois, R.B. Tully, N. Bonhomme, L. Rizzi, and M. Zavodny (2009)
`The Extragalactic Distance
Database: Hawaii Photometry Catalog'
while parallel Spitzer Space Telescope photometry at 3.6 microns is presented by J.G. Sorce, H.M. Courtois, and
R.B. Tully (2012)
`The Mid-infrared Tully-Fisher
Relation: Spitzer Surface Photometry'


The HI and photometry information is used to derive
distances based on the correlation between galaxy luminosity and linewidth (the
Tully-Fisher Relation).
The preliminary calibration, involving comparisons to assure that distances by
different methods are on a common scale culminating in a synthesis of distances by
several methods, resulted in the catalog "Cosmicflows-1 Distances" discussed by
R.B. Tully, E.J. Shaya, I.D. Karachentsev, H.M. Courtois, D.D. Kocevski, L. Rizzi, and A. Peel
ApJ, 676, 184 (2008).
The figure below on the left is extracted and modified from this reference.
It illustrates the components of our motion that arise from the pull
of the Virgo Cluster and a push from the Local Void. The figure on the right is a velocity field
reconstruction using the Monge-Ampere-Kantorovich (MAK) technique applied to the 2MASS Redshift Survey
Ks<11.25 sample and constrained with observed distances (G. Lavaux, R.B. Tully, R. Mohayaee, and S. Colombi Cosmic Flow from 2 Micron All-Sky
Redshift Survey).
 |
 |
 |

|
 |
 |
Support for the development of content for this database is provided by the National Science Foundation under Grant No. AST09-08846.